What is Tokenomics? - Vol. 2
Token Release, Allocations, and Vesting
What is Tokenomics?
It’s more than just a casual DYOR (do your own research). Understanding the economics behind a token is a critical step in understanding any potential crypto investment.
In the second post of the series on Tokenomics, we begin to understand token release, initial token allocations, emissions, and more about token supply dynamics (here’s the first piece of the series).
Initial Distribution & Supply
Think twice before you pop on your crypto app to load up on the latest token, far more dynamics are at play. The initial distribution and emissions schedule of a token create its supply and demand dynamics.
We’ll focus this piece on how tokens are allocated and released over time because these two mechanisms answer the important question: how does the future supply change? The answer can have a real effect on price.
Initial Distribution
A token is either pre-mined or fair-launch, where everyone competes. Notable fair-launch projects include yearn.finance and bitcoin.
Nearly all of the tokens launched today, though, are pre-mined — insiders preserve a portion before opening to public. These preserved token allocations typically falling into five segments:
Community Treasury: retained for future distribution. This is a pool of reserves to be allocated later, typically to the public.
Core Team: Reserved for founders, advisors, employees, etc. It reflects the team’s equity ownership in the project.
Ecosystem Incentives: this allocation is set for growth programs like staking rewards, participation rewards, airdrops, and yield farming.
Insiders / Private Investors: allocation for capital providers who purchased equity that later converted to tokens or was tokens initially (SAFT or SAFTE or SAFE + T).
Public Sale: these tokens are sold to the public. This is the token allocated for the ICO.
Often times, these buckets are shown as pie charts. When you see these bar charts, think, “Initial Token Distribution”
Let’s look at an example.
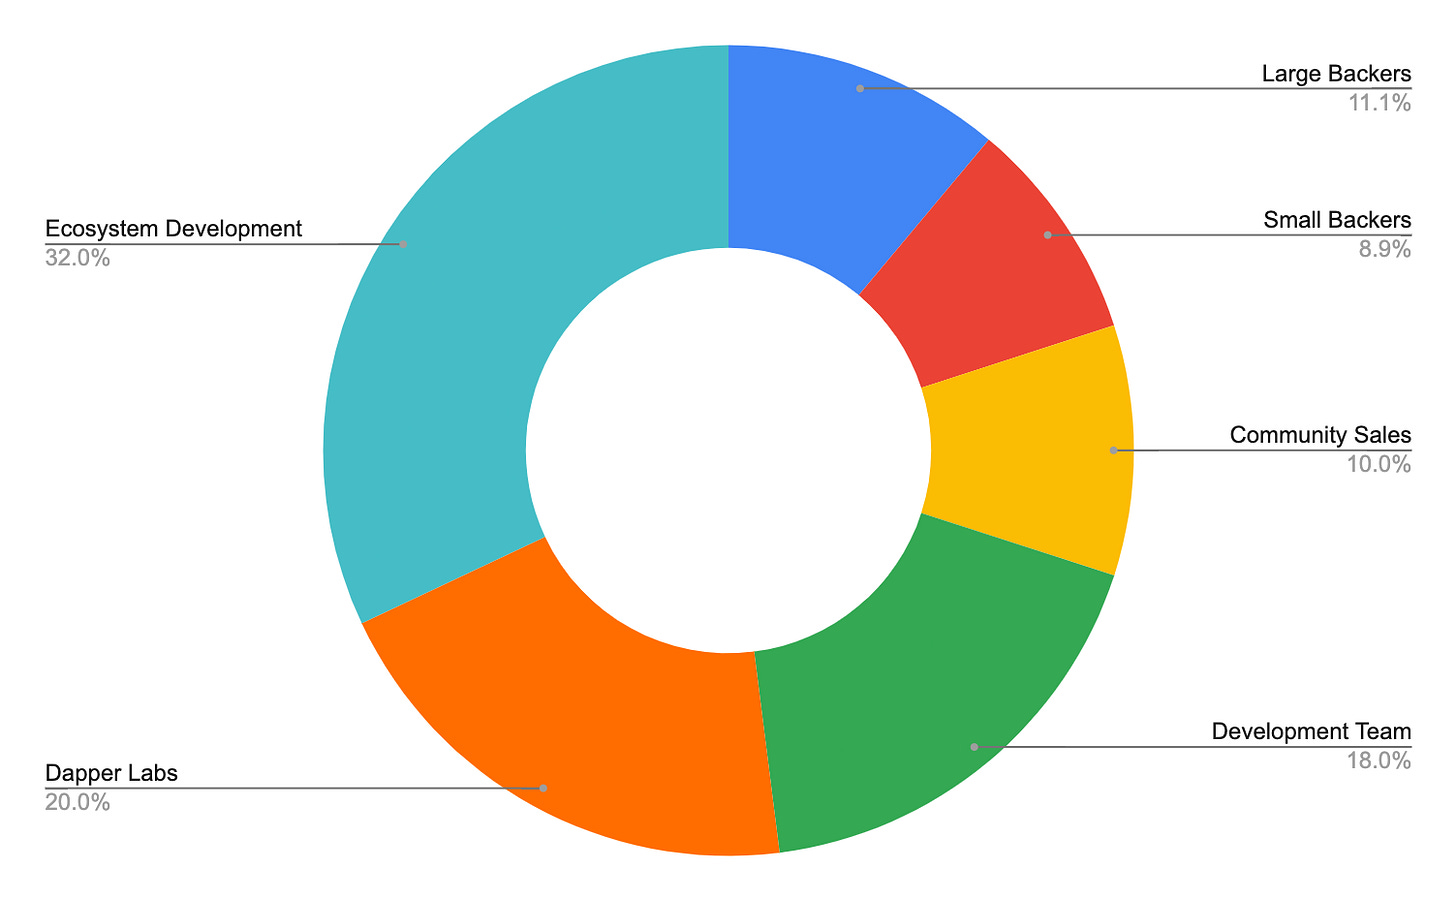
We talked about the FLOW token last time. Reminder: Flow is inflationary (increasing supply) with no maximum supply cap. From the Flow website, the genesis allocation of 1.25 billion FLOW tokens is below:
It’s important to get a sense for each allocation. You may notice there are more than five categories, but here we can take a closer look.
Dapper Labs, Large Backers, and Small backers fall under Insiders.
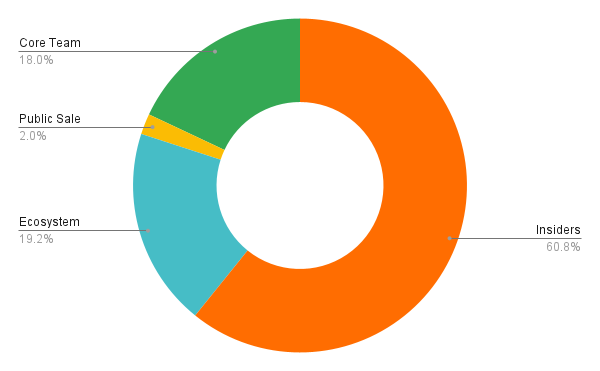
Ecosystem Development is trickier. As defined by Flow, Ecosystem Development includes both incentives for the “Foundation” and the community “Collateral Reserve”. Because of the opaque nature of the “Foundation Reserve” we categorize it as Insiders and the Collateral Reserve as Ecosystem Incentives, leaving four categories.
For Flow, nearly 80% of the tokens are allocated to insiders or the team — a significant portion. Is Flow blockchain decentralized? No, Flow is not very decentralized. The new allocation is below.
There are no rules on initial distribution. However, if a token is 80% controlled by a team, investors should be aware and wary that normal market dynamics might not apply. Token allocations are experimental and constantly evolving across categories. Scroll to resources to read about how optimal token distribution has changed over time.
When digging into a project, you want a sense of how many investors hold the token, how many tokens were given to the community, and how “fair” the token was distributed.
Emissions
We previously discussed circulating supply and its effects on token price and market cap calculations. We explored Circulating Supply, Total Supply, Max Supply, and MC/FDV ratios. This week, we’ll show how these numbers play out in a real world example in Flow.
After the distribution, you need to understand the emissions schedule. What does an emissions schedule mean? Tokens that are initially distributed to insiders or the core team are typically locked so they cannot be immediately traded in public markets. They are not included in the circulating supply number until they vest. Similarly to public stock options, vesting periods lock the tokens for a set length of time according to a set schedule.
Cliff Vesting: a certain period of time must pass before first token is released (in crypto, this cliff is typically one, two, or three years post-ICO)
Linear Vesting: the token is unlocked slowly over time (typically with monthly unlocks)
Also, newly minted supply can come into the market via emissions. Emissions are typically rewards for stakers, or locked tokens set aside by the protocol at genesis for liquidity mining.
Between token vesting and emissions, new supply is frequently hitting the markets. To avoid a negative price impact, buyers, with funds amounting to price x quantity of new tokens, are needed to absorb the added supply.
Flow’s Emissions and its Affect on Price
At FLOW’s launch, 1.25 billion tokens were released (Total Supply). Nearly 32% of those initial tokens are still locked, with a cliff vesting period approaching in two months.
Crypto projects typically have a combined cliff and linear vesting format structured as Y years cliff, unlocking linearly over T years. Here, Y is usually between six months and one year, and T is often between one and three years. For example, the FLOW public genesis sale vesting schedule had a 1 year cliff with the tokens unlocking linearly over 1 year after the cliff.
Token unlocks dilute token supply. Also, those unlocked tokens held by insiders were often acquired at a low cost basis.
Flow had three separate funding rounds to Private Investors with a cost basis of $0.01 per FLOW. Considering a current price of $2.13 per FLOW, these early owners have more financial incentive to sell at the market price and lock in a 20,000% gain. Understandably these unlocking events usually put increased sell pressure on the token (though not always).
As tokens become unlocked, they are added to the liquid circulating supply. Here’s the projected emissions schedule for FLOW, showing how the circulating supply will grown over time as tokens become unlocked.
However, something looked strange when we looked at the graph for actual circulating supply. In the chart above, circulating supply is projected to be 518M on July 31, 2022. But we noticed that on May 12, 2022, the circulating supply of Flow shot up from 364M to 1B.
Upon further investigation, Flow released an announcement explaining that circulating supply had changed due to a methodology update! In other words, 3x more tokens were circulating on the market than had previously been reported, adding “It is important to note that these coins have already been freely circulating and there are no net new coins or other net new activities contributing to increased circulating supply.” The only people that knew this were the centralized Flow team who controlled 80% of the coins. In the timeframe between May 4th and May 12th, the Flow token dropped 47%.
The market viewed these changes as dilutive and acted accordingly. This is an example of a risk associated with investing in centralized protocols when the space has token distributions without any rules.
It’s a great argument for decentralized coin distributions, which are far less common. For example, Yearn completed a fair-launch distribution, in which no coins were locked up, meaning every coin was in circulation at launch. An unexpected methodology update could never happen with Yearn or Bitcoin tokens.
Sure, there are other market dynamics happening all the time that influence price, but it’s impossible to ignore the effects of token unlocking events and the importance of circulating supply. Be sure to take a look at the emissions schedule, usually listed in project documents or websites.
A Final Note on Wallet Holders and Volume
Once a token is released and you have an understanding of the emissions schedule, you can take an extra step to understand existing holders. It can help to answer the following questions:
Do any wallets stand out with huge shares of supply?
How much do the top 100 wallets collectively own?
How many total holders are there?
What is the typical transaction size or daily volume?
Asking these questions will help to expose risks surrounding whale holders or low-volume trading.
Volume is a last consideration we’ll discuss, but by no means the least important. The average daily volume of any token is the average dollar value of all token trades across all exchanges. FLOW’s 24-hour volume in the CoinMarketCap image above is $56m. Volumes are aggregated from each exchange — ie: Binance, Coinbase, or Uniswap — as well as for each trading pair — ie: FLOW/USDT and FLOW/USDC and FLOW/USD. Volume determines participants. A large institutional fund cannot participate in low-volume tokens because of how the token’s price will be affected. Volumes can be a good indicator for token price momentum in the near term.
Answering each of these questions is beyond the scope of this post, but stand to demonstrate that there are multiple layers of questions, risks, and factors to gain a clearer understanding token supply dynamics.
Next Time…
In this piece we explored supply allocation and emission. It’s important to understand how supply changes for a particular token, especially one that’s under consideration for an investment.
In subsequent posts, we will dive into incentive design, demand and utility, and more evaluation strategies.
The next post will help to answer questions like: how do tokens create incentives? how are tokens designed to add value? and more.
Resources
A Twitter thread on optimizing token distribution.
Diving into Starting Liquidity and Emissions Rate.
FLOW token distribution documentation.
Nat Eliason: Tokenomics 102.


